Metal stamping die quotation & cost estimation: what are the practical formulas and key drivers?
I face tight budgets often, and delays still threaten launches. I restore cost clarity fast.
A stamping-die quote1 depends on die type, size, standards, and risk. Use quick rules first. Then confirm with engineering math2. Align timing, packaging, and certification to lock the number.
I keep this simple and direct. I share formulas, checklists, ROI math, and firm commitments that reduce spread.
How much does a die cost, and when should I choose progressive or single-stage dies?
I see buyers fear wide price ranges. I show realistic bands first. Then I match each band to volume and takt.
Progressive dies fit higher volumes and tighter takt. Single-stage dies fit lower volumes and larger parts. Progressive tools often cost 1.5×–3× more than single-stage sets, yet they cut piece cost and improve alignment. I ground these choices in certified processes that reduce variation and cost spread, as outlined by ISO and ASQ guidance, which I follow in our quoting flow (ISO 9000 family, ISO 9001 overview, ASQ ISO 9001). ([International Organization for Standardization][1])
Dive deeper: volume, price bands, and ROI choices
First, I align die strategy with annual volume and takt. Then I review geometry, feed pitch, and press availability. Next, I weigh scrap risk and change risk. So the selection stays rational, not emotional.
I use clear price bands from our build history since 1993. Progressive dies1 with 300–1000 mm faces usually range \$25k–\$180k. Single-stage dies with 200–800 mm faces usually range \$8k–\$80k. Transfer or line dies for large panels can reach \$80k–\$350k. These bands move with component brands, insert density, and tryout scope. Therefore I run a break-even on cycle time2, scrap, and labor. Then I add sharpening cost and planned regrinds. Finally, I model change risk so the business case stays tied to real conditions, not opinions.
How can I estimate more accurately: “Material Cost × Multiplier” or “Die Surface Size Factor”?
Teams often debate methods. I use both, then I cross-check. After that, I adjust for risk, standards, and timing.
Method A (BOM × Multiplier). I build the material BOM for plates, shoes, punches, inserts, and standards. Then I multiply to cover machining, EDM, heat treat, design, tryout, and overhead. Typical ranges: progressive 6–8×; single-stage 2.5–3.5×. Automotive scope can add 10%–25% for PPAP, traceability, audits, and capability runs, which align with AIAG Core Tools practice (AIAG Quality Core Tools).
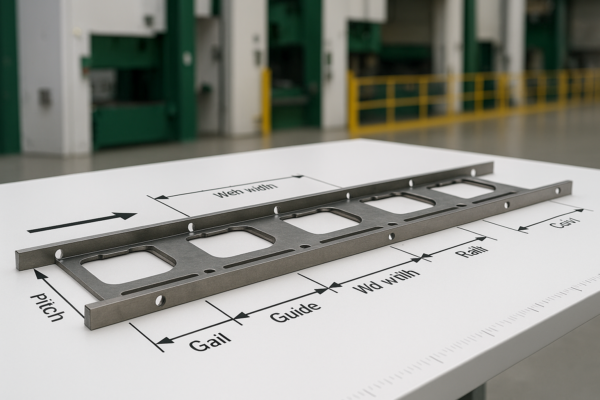
Method B (Die Surface-Area Factor). I measure lower die plate length × width. Then I apply a coefficient by complexity and station count. Progressive often uses 0.22–0.28 USD/mm²; single-stage often uses 0.10–0.13 USD/mm². Deep draws or many sensors add 0.03–0.06 USD/mm². I finalize numbers after I verify drawing clarity with ASME Y14.5 and share a concise GD\&T primer for non-experts (ASME Y14.5, GD\&T Basics explainer).
How do I calibrate the two methods using the latest three orders?
I back-check both methods against our latest three builds. I keep brand components, inserts, and documentation scope constant. Then I compare each method’s prediction with the signed PO.
Prime commitment: when BOM×Multiplier1 and Surface-Area Factor2 differ by ≤10–15%, I take the midpoint and lock it. This rule shortens reviews and raises trust.
| Recent job (anonymized) | BOM × Multiplier | Surface-Area Factor | PO tool price | Gap between methods | Locked quote (midpoint rule) |
|---|---|---|---|---|---|
| A: 6-station progressive, 650×320 mm | \$46,900 | \$51,800 | \$50,900 | 9.5% | \$49,350 |
| B: single-stage pierce/form, 420×280 mm | \$19,200 | \$21,000 | \$20,300 | 8.6% | \$20,100 |
| C: progressive with draw, 820×420 mm | \$87,600 | \$101,900 | \$96,800 | 15.9% → DFM trimmed | \$94,750 |
When the gap exceeds 15%, I trigger a focused DFM. I re-check station count, insert density, sensor plan, and steel grade. Then I re-issue a single number, still aiming to land on the midpoint after scope alignment.
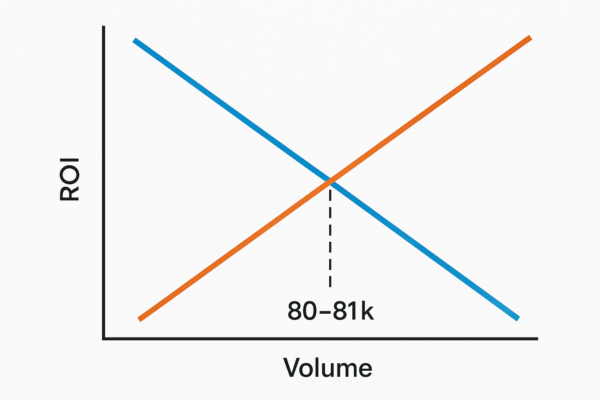
How do I compute the ROI crossover volume with a numeric example?
I stop guesswork with a simple rule. Crossover volume N* equals tooling cost delta divided by per-piece savings.
Formula: N* = (Cost_progressive − Cost_single) ÷ (Unit-cost_single − Unit-cost_progressive)
Example (target ≈81k/year):
- Progressive tool cost: \$105,000
- Single-stage set cost: \$60,000
- Tooling delta: ΔC_tool = \$45,000
Per-piece economics:
-
Labor + press: 8 ppm single vs 50 ppm progressive at \$140/hr
- Single: \$140/480 = \$0.292/pc
- Progressive: \$140/3000 = \$0.046/pc
- Savings: \$0.246/pc
- Material use: progressive improves utilization by 5% on a \$2.20 blank → \$0.110/pc
- Scrap drop: 7% → 3% on a \$2.20 blank → \$0.088/pc
- Maintenance + sharpening delta: \$0.060/pc
- Fewer sorts and in-line gauging: \$0.056/pc
Total unit savings Δc_piece ≈ \$0.56.
Crossover N* = \$45,000 ÷ \$0.56 ≈ 80,357 pcs.
So if your annual demand sits near 81k pieces1, the progressive tool2 pays back within one year. Above that level, progressive usually wins. Below that level, a single-stage path often protects capital.
Why do identical drawings receive different quotes from suppliers?
Buyers often send one print and get a wide spread. I explain why that happens. Then I show how to control it.
Design standards, component brands, documentation level, and region create variance. I freeze plate thickness, guide-post class, and hardness. I also lock coatings, EDM classes, and grind flatness. Then I set component families using catalogs that your engineers can verify, like MISUMI press-die components, Dayton Lamina (Danly/IEM) catalogs, and NAAMS standards (MISUMI, Dayton Lamina, NAAMS).
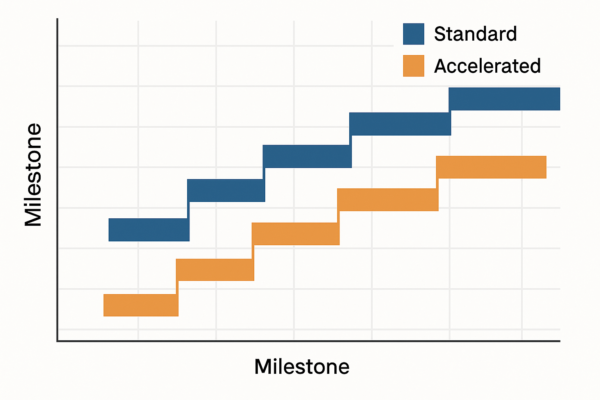
What lead times can I plan, and what are the milestones?
I publish a clear matrix and show expedite paths. I also tie each path to fixed milestones so teams can plan.
Lead-time matrix
| Tooling type | Standard lead time | Rush option | Notes |
|---|---|---|---|
| Single-stage | 6–10 weeks | 4–6 weeks | Feature changes add time |
| Progressive | 8–16 weeks | 6–10 weeks | Sensorized tools trend longer |
| Transfer/line | 12–24 weeks | 10–16 weeks | Transfer fingers add weeks |
Milestone ladder
RFQ intake and NDA → DFM and risk list → Design freeze and PO → Steel order and roughing → EDM and heat treat → Precision grind → Assembly and bench debug → Tryout T0 and corrections → T1 with capability run → PPAP submission (Level 3 default) → Crating and logistics → On-site support.
For tonnage selection and energy across the stroke, I align choices with AIDA and MetalForming explainers, which clarify rating points and energy vs position (AIDA servo vs mechanical, MetalForming tonnage and energy).
Which standards and metrics do you apply by default?
I keep standards visible, because they reduce risk and speed audits. I run ISO 9001 for QMS. I align to IATF 16949 requirements for automotive programs when required. I also support ISO 14001 environmental controls and apply AIAG CQI special-process assessments through approved partners. You can confirm each framework at the official portals, which I follow during audits and buyoffs (IATF official site, ISO 14001, ISO on QMS).
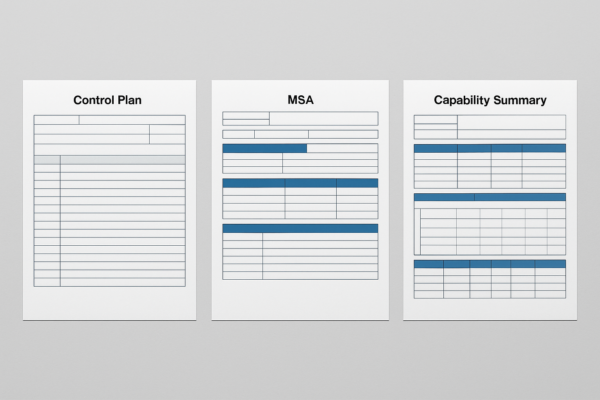
I default to PPAP Level 3 unless you request otherwise. The pack includes PSW, control plan, PFMEA, MSA, capability, and dimensional, as defined by AIAG PPAP guidance (AIAG core tools, AIAG PPAP manual). I set AQL at 0.65% critical, 1.0–1.5% major, and 2.5% minor by default, and I tighten if needed. I target Cp/Cpk ≥ 1.33 for critical features and ≥ 1.67 for safety features. I drive MSA/GRR toward ≤ 10% preferred, ≤ 20% acceptable.
For drawing clarity, I require ASME Y14.5 and share a short GD\&T Basics primer inside my DFM emails, which keeps teams aligned and reduces rework (ASME Y14.5 page, GD\&T primer).
What commercial terms reduce quote spread and legal back-and-forth?
I publish business rules upfront, so quotes converge and teams move faster. I also link the catalogs and press resources inside scope paragraphs, not in separate blocks.
Tool ownership and warranty. Ownership transfers after final buyoff and full payment. Standard warranty is 12 months or 1,000,000 strokes, whichever comes first. Warranty covers workmanship, alignment, and hardening defects under normal use.
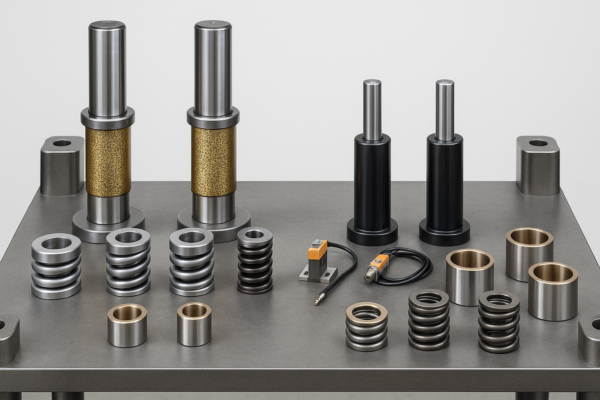
Spare-parts starter kit (recommended). Pilot pins ×10; punches (critical sizes) ×10 each; bushings and guide posts ×1 set; stripper or gas springs ×1 set; sensors and cables ×1 set; wear plates and keys ×1 set; fasteners and clamps ×1 set; lubricant and rust inhibitor ×1 lot. I standardize brands and alternates using MISUMI and Dayton Lamina (Danly/IEM) to lock sizes and finishes early (MISUMI Press Die Components, Dayton Lamina catalogs).
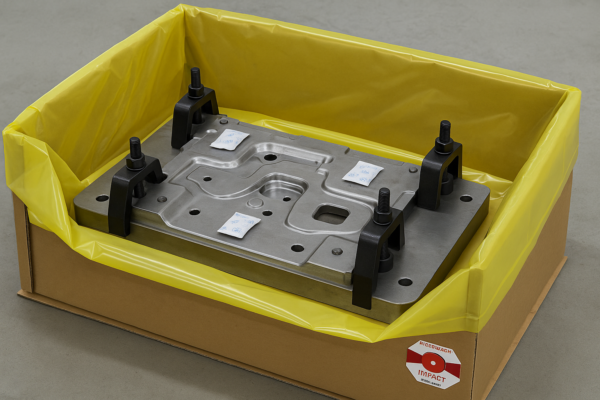
Incoterms and packaging. I support FCA, FOB, CIF, or DAP. Export crates include VCI wrap, bolt-down clamps, corner guards, desiccants, and shock/tilt indicators. I mark clamp points and lifting eyes on the drawing.
ECR/ECO change process. You submit an ECR with drawings and reason. I reply in 24–48 hours with cost, timing, and risk. You confirm an ECO with scope and budget. I execute changes and re-issue capability as needed.
Payment templates. Choose 40/40/20 (design start / assembly / T1 buyoff) or 30/40/30 (design start / T0 / PPAP approval). I also support letters of credit or net terms for approved accounts.
FAQs
How do you quote when drawings lack tolerances? I apply clear title-block defaults and request function notes. I also flag risk and offer options. When teams need a shared language, I point to ASME Y14.5 and a concise GD\&T Basics explainer, which I include in my DFM notes to keep everyone aligned (Y14.5, GD\&T Basics).
What is your hard promise on method agreement? If BOM×Multiplier and Surface-Area Factor differ by ≤10–15%, I take the midpoint and honor it on the quote.
How do you size press tonnage quickly? I use perimeter × thickness × shear strength, then I add 20% safety. I also verify stroke and energy with press references from The Fabricator, AIDA, and MetalForming, which explain rating points and energy needs across the stroke (The Fabricator press tonnage, AIDA tonnage and energy, MetalForming tonnage and energy).
References
- ISO. “ISO 9000 family — Quality management.” https://www.iso.org/standards/popular/iso-9000-family . ([International Organization for Standardization][1])
- ISO. “ISO 9001:2015 — Quality management systems.” https://www.iso.org/standard/62085.html . ([International Organization for Standardization][8])
- ASQ. “ISO 9001.” https://asq.org/quality-resources/iso-9001 . ([ASQ][9])
- ASME. “Y14.5 Dimensioning and Tolerancing.” https://www.asme.org/codes-standards/find-codes-standards/y14-5-dimensioning-tolerancing . ([asme.org][3])
- GD\&T Basics. “The ASME Y14.5 GD\&T Standard.” https://www.gdandtbasics.com/asme-y14-5-gdt-standard/ . ([gdandtbasics.com][10])
- AIAG. “Quality Core Tools.” https://www.aiag.org/expertise-areas/quality/quality-core-tools . ([aiag.org][2])
- AIAG. “PPAP-4 Manual.” https://www.aiag.org/training-and-resources/manuals/details/PPAP-4 . ([aiag.org][11])
- IATF. “About IATF 16949.” https://www.iatfglobaloversight.org/iatf-169492016/about/ . ([iatfglobaloversight.org][6])
- ISO. “ISO 14001:2015 — Environmental management systems.” https://www.iso.org/standard/60857.html . ([International Organization for Standardization][12])
- AIDA. “Servo vs. Mechanical: Understanding Tonnage and Energy.” https://www.aida-global.com/metalforming-articles/servo-vs-mechanical-understanding-tonnage-and-energy/ . ([aida-global.com][5])
- MetalForming Magazine. “Tonnage and Energy.” https://www.metalformingmagazine.com/article/?%2Fstamping-presses%2Fmechanical%2Ftonnage-and-energy= . ([MetalForming Magazine][13])
- The Fabricator. “Understanding press tonnage.” https://www.thefabricator.com/thefabricator/article/bending/understanding-press-tonnage . ([The Fabricator][7])
- MISUMI. “Press Die Components.” https://us.misumi-ec.com/vona2/press/ . ([us.misumi-ec.com][4])
- Dayton Lamina. “Catalogs.” https://www.daytonlamina.com/resources/documents/catalogs . ([daytonlamina.com][14])
- NAAMS Standards. “Global Standard Components.” https://naamsstandards.org/ . ([naamsstandards.org][15])
Conclusion
Choose Prime for accurate die quotes, fast delivery, and stable quality; request a free consultation and a tailored quotation today. I will apply the ≤10–15% midpoint rule, include ROI math, and attach a milestone plan that matches your window.
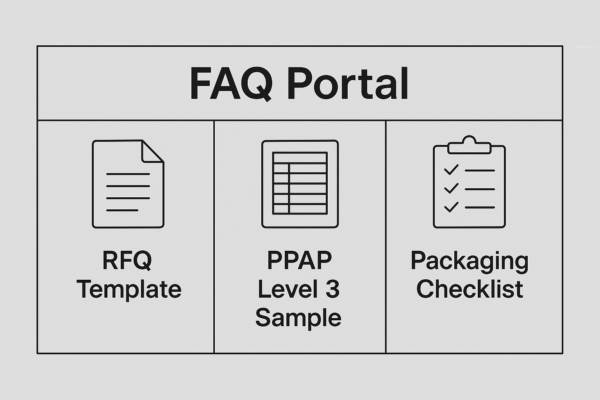
Prime operates in China with 10 production lines. We founded the company in 1993. We ship stamping parts, CNC parts, casting parts, welding parts, fasteners, and plastic parts globally. Send your RFQ today. I will reply fast with a firm schedule, PPAP plan, packaging spec, and logistics options.